
The debt-to-equity ratio or D/E ratio is an important metric in finance that measures the financial leverage of a company and evaluates the extent to which it can cover its debt. It is calculated by dividing the total liabilities by the shareholder equity of the company.
It shows the proportion to which a company is able to finance its operations via debt rather than its own resources. It is also a long-term risk assessment of the capital structure of a company and provides insight over time into its growth strategy.
A high D/E ratio suggests that the company is sourcing more of its business operations by borrowing money, which may subject the company to potential risks if debt levels are too high.
A low D/E ratio shows a lower amount of financing by debt from lenders compared to the funding by equity from shareholders.
Basically, the more business operations rely on borrowed money, the higher the risk of bankruptcy if the company hits hard times. The reason for this is there are still loans that need to be paid while also not having enough to meet its obligations.
A good D/E ratio also varies across industries since some companies require more debt to finance their operations than others.
Debt financing happens when a company raises money to finance growth and expansion through selling debt instruments to individuals or institutional investors to fund its working capital or capital expenditures.
The company then commits to repaying the loan and the incurred interest.
Debt financing includes bank loans, bond issues, and credit card loans. It is the opposite of equity financing, which is another way to raise money and involves issuing stock in a public offering.
There are various companies that rely on debt financing to grow their business. For example, Nubank was backed by Berkshire Hathaway with a $650 million loan .
The loan is said to be invested in the Mexican and Colombian markets that will target technology development and product innovation, attract talent, and build up its customer base.
Another example is Wayflyer, an Irish-based fintech, which was financed with $300 million by J.P. Morgan to fund its rapid growth.
Here are some reasons why companies choose to use debt financing:
Debt financing is often seen as less risky than equity financing because the company does not have to give up any ownership stake.
The debt capital is given by the lender, who only receives the repayment of capital plus interest. Whereas, equity financing would entail the issuance of new shares to raise capital which dilutes the ownership stake of existing shareholders.
Debt financing is a cheaper alternative to equity financing.
For example, let us say a company needs $1,000 to finance its operations. If the company were to use equity financing, it would need to sell 100 shares of stock at $10 each.
However, if the company were to use debt financing, it could take out a loan for $1,000 at an interest rate of 5%.
Over time, the cost of debt financing is usually lower than the cost of equity financing. This is because when a company takes out a loan, it only has to pay back the principal plus interest.
On the other hand, when a company sells equity, it gives up a portion of its ownership stake in the business. The investor will then participate in the company's profits (or losses) and will expect to receive a return on their investment for as long as they hold the stock.
Interest payments on debt are tax-deductible, which means that the company can reduce its taxable income by deducting the interest expense from its operating income. This is an advantage that equity financing does not have.
The principal payment and interest expense are also fixed and known, supposing that the loan is paid back at a consistent rate. It enables accurate forecasting, which allows easier budgeting and financial planning.
The D/E ratio of a company can be calculated by dividing its total liabilities by its total shareholder equity.
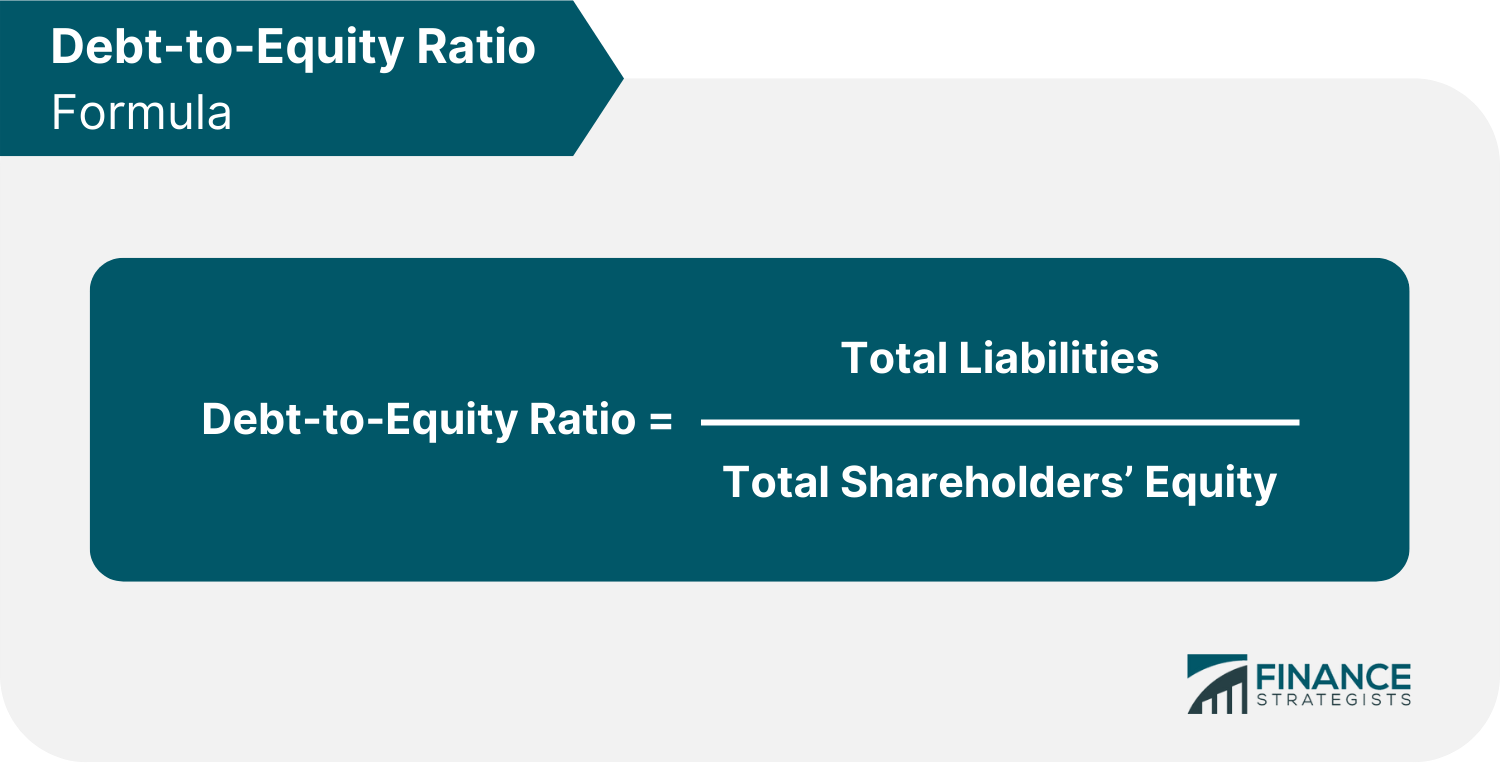
This calculation gives you the proportion of how much debt the company is using to finance its business operations compared to how much equity is being used.
For instance, let us compute the D/E ratio of Tesla, Inc. Data from their 10-K statement for the fiscal year (FY) ended 2021 . Tesla had total liabilities of $30,548,000 and total shareholders' equity of $30,189,000.
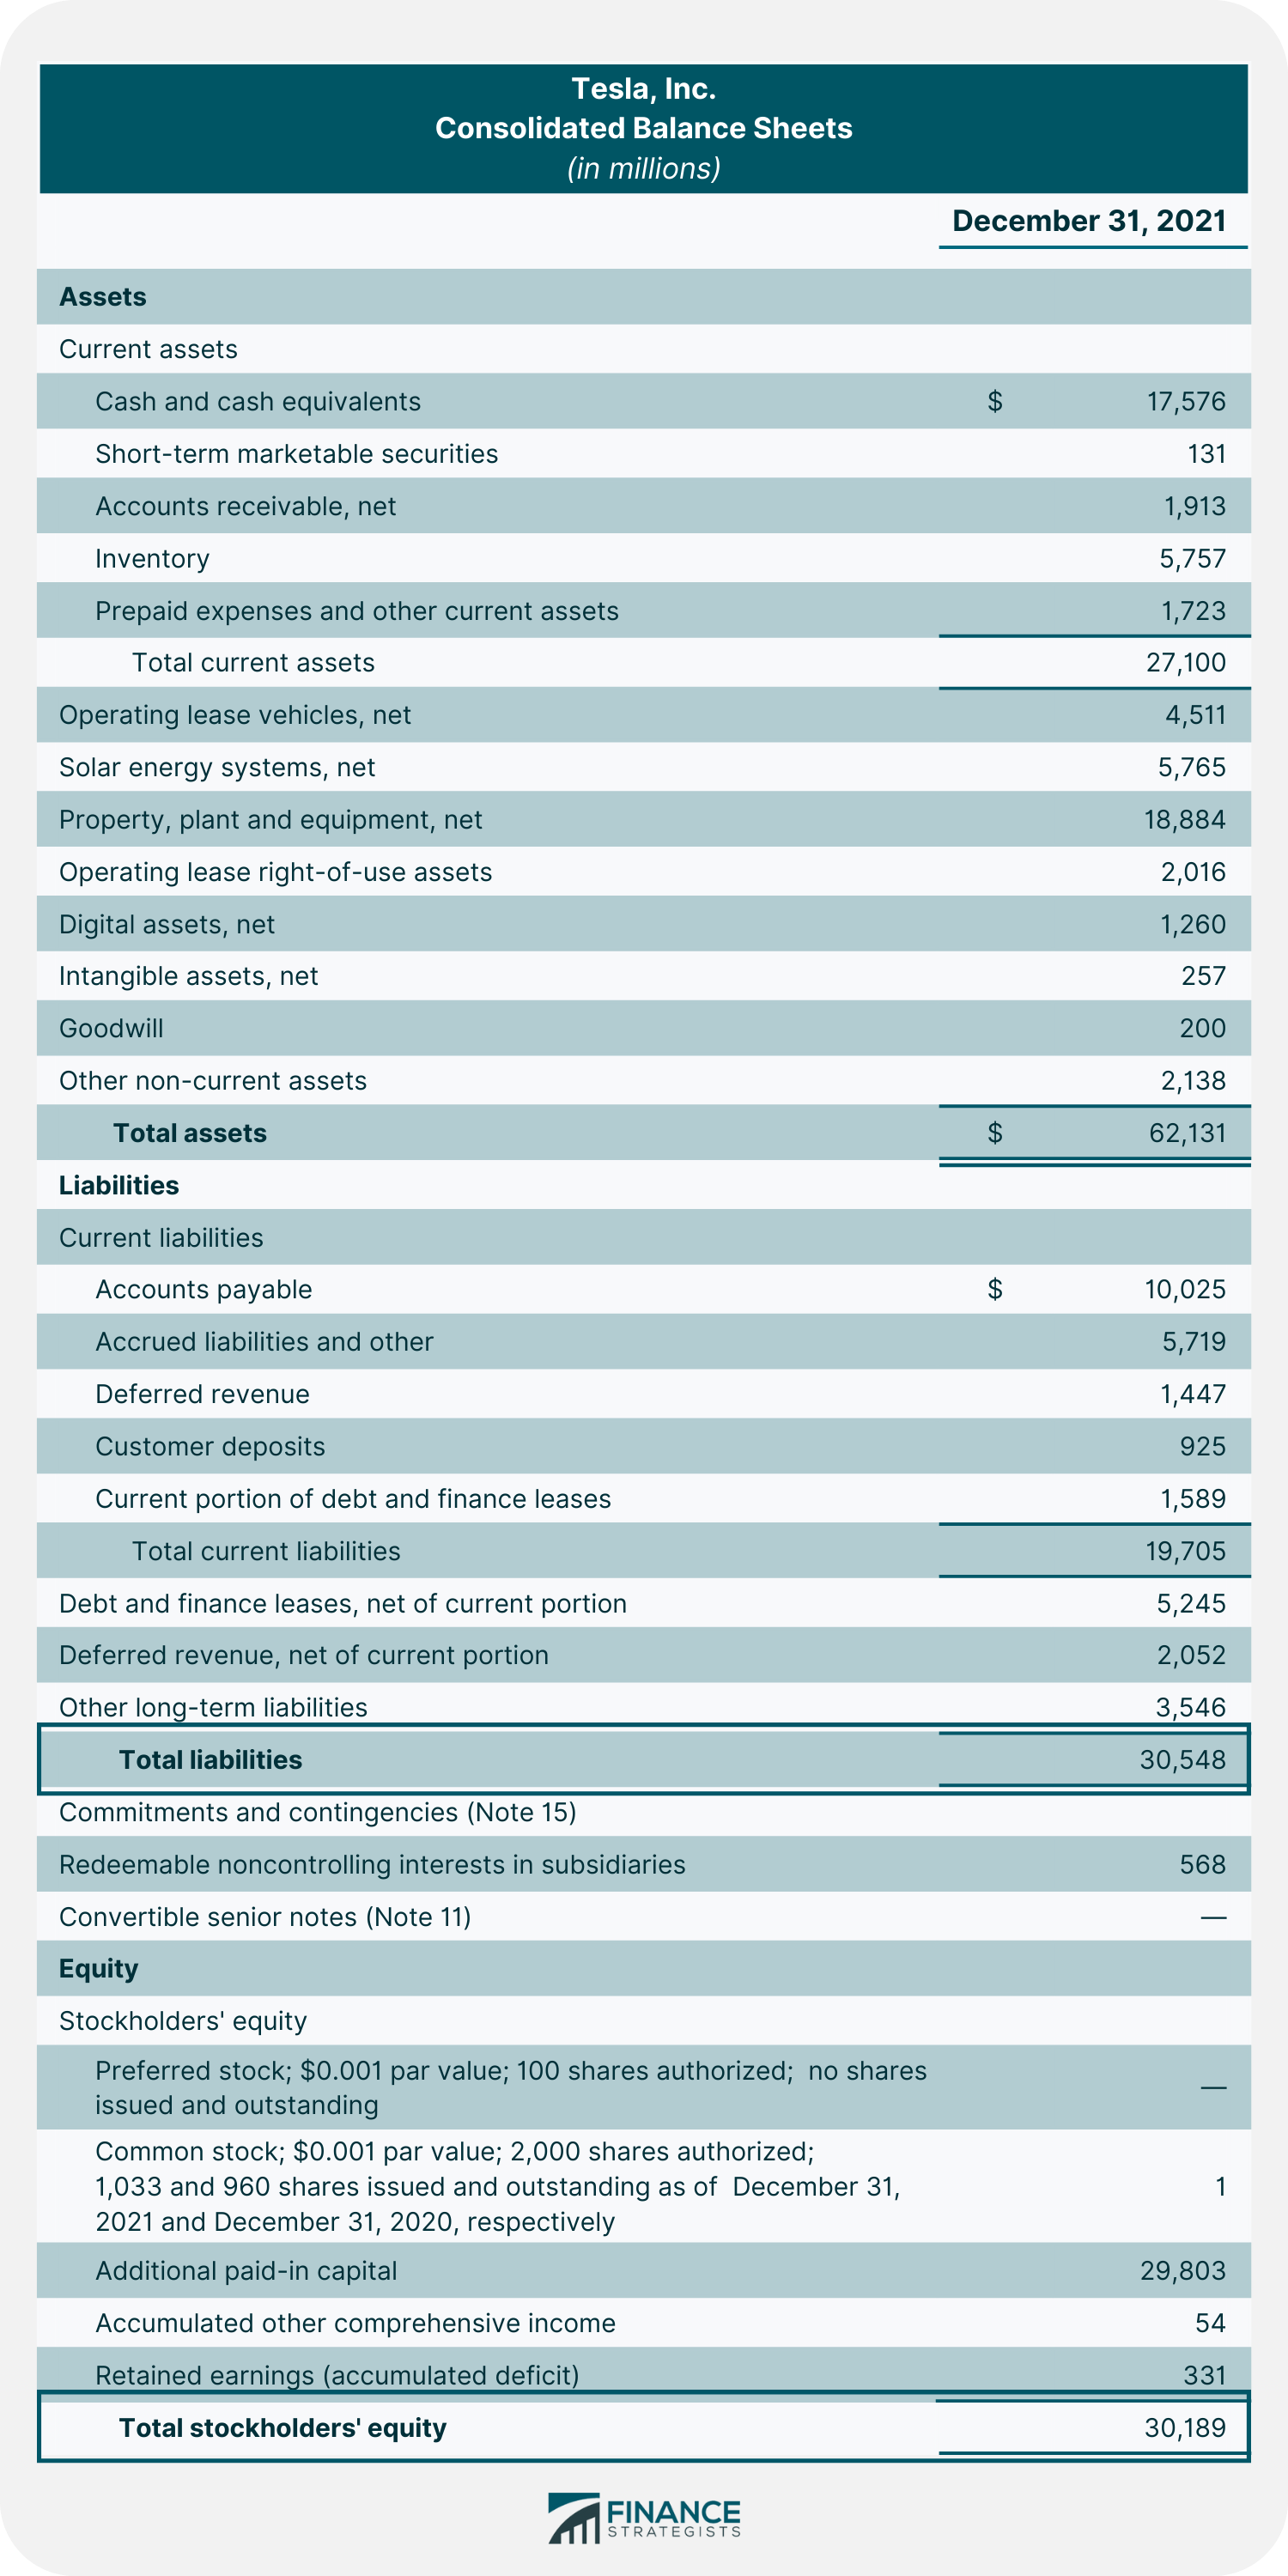
Using the formula above, the D/E ratio of Tesla will be:
Debt-to-Equity Ratio = $30,548,000/$30,189,000
This means that Tesla had $1.01 of debt for every $1.00 of equity.
The D/E ratio is a good way to measure a company's leverage. A higher D/E ratio means that the company has been aggressive in its growth and is using more debt financing than equity financing.
A lower D/E ratio suggests the opposite - that the company is using less debt and is funded more by shareholder equity.
Generally, a D/E ratio of more than 1.0 suggests that a company has more debt than assets, while a D/E ratio of less than 1.0 means that a company has more assets than debt.
However, the D/E ratio does not take into account the business industry. A good D/E ratio of one industry may be a bad ratio in another and vice versa.
For example, asset-heavy industries such as utilities and transportation tend to have higher D/E ratios because their business models require more debt to finance their large capital expenditures.
In contrast, service companies usually have lower D/E ratios because they do not need as much money to finance their operations.
Investors, lenders, stakeholders, and creditors may check the D/E ratio to determine if a company is a high or low risk.
Although debt financing is generally a cheaper way to finance a company's operations, there comes a tipping point where equity financing becomes a cheaper and more attractive option.
When it comes to choosing whether to finance operations via debt or equity, there are various tradeoffs businesses must make, and managers will choose between the two to achieve the optimal capital structure.
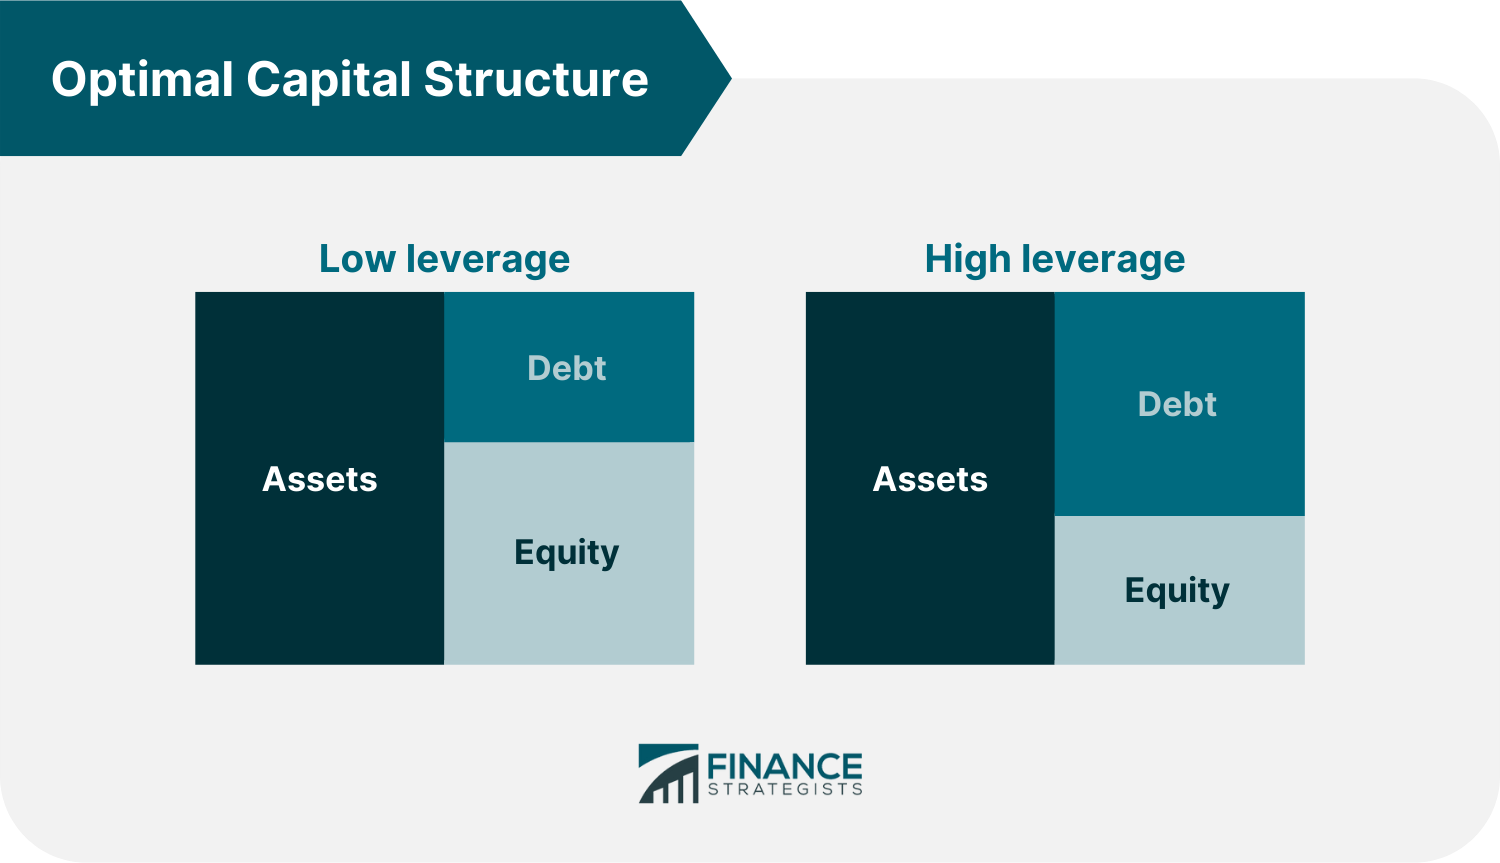
When a company takes in a lot of debt, its D/E ratio will go up.
If a company's D/E ratio is too high, it may be considered a high-risk investment because the company will have to use more of its future earnings to pay off its debts.
This could lead to financial difficulties if the company's earnings start to decline especially because it has less equity to cushion the blow.
Managers can use the D/E ratio to monitor a company's capital structure and make sure it is in line with the optimal mix.
If the D/E ratio gets too high, managers may issue more equity or buy back some of the outstanding debt to reduce the ratio. Conversely, if the D/E ratio is too low, managers may issue more debt or repurchase equity to increase the ratio.
It is important to note that the D/E ratio is one of the ratios that should not be looked at in isolation but with other ratios and performance indicators to give a holistic view of the company.
The D/E ratio alone does not tell you the whole picture of a company's financial leverage. The following are some of the limitations of using only the D/E ratio in assessing a company’s financial health:
Different industries vary in D/E ratios because some industries may have intensive capital compared to others.
For instance, the telecommunications industry like AT & T, Inc., which had a D/E ratio of 1.93 at the end of December 2020, needs to have substantial investments in its fiber network expansion and wireless network enhancements, which allows them to provide instant connectivity at higher speeds.
Aside from that, they need to allocate capital expenditures for upgrades, maintenance, and expansion of service areas.
Utilities and financial services typically have the highest D/E ratios, while service industries have the lowest.
Using the D/E ratio to assess a company's financial leverage may not be accurate if the company has an aggressive growth strategy.
If the company is aggressively expanding its operations and taking on more debt to finance its growth, the D/E ratio will be high. However, this does not necessarily mean that the company is in trouble.
For instance, Moody's Corp had a D/E ratio of 9.11 at the end of 2019 due to a number of acquisitions. They had acquired a majority stake in Four Twenty Seven, Inc. and Deloitte's ABS Suite Business .
There are other liquidity ratios that can be used for specific purposes related to the D/E ratio. The following are some of them:
The cash ratio compares the cash and other liquid assets of a company to its current liability. This method is stricter and more conservative since it only measures cash and cash equivalents and other liquid assets.
The formula for cash ratio is as follows:
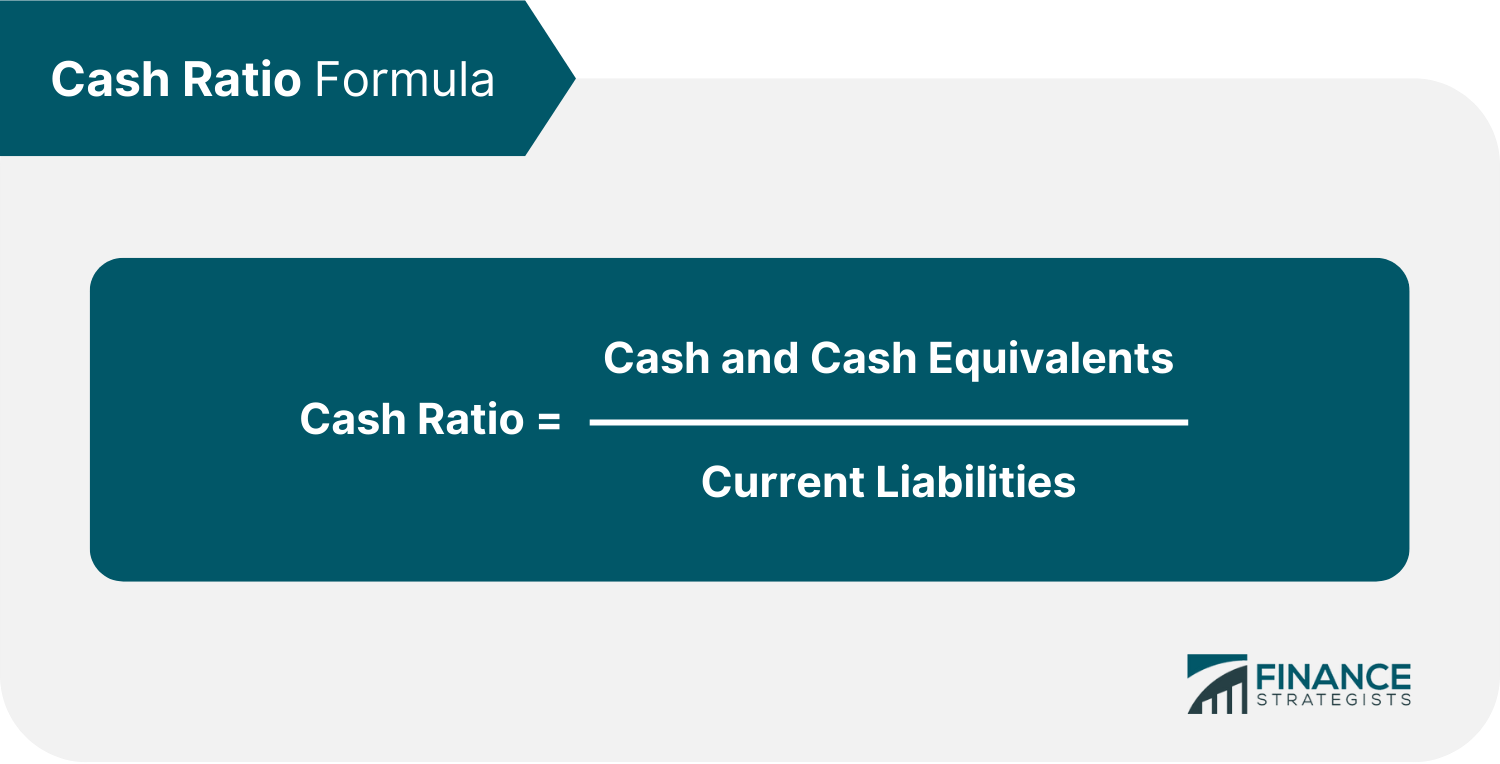
The cash ratio provides an estimate of the ability of a company to pay off its short-term debt.
For instance, a company with $200,000 in cash and marketable securities, and $50,000 in liabilities, has a cash ratio of 4.00. This means that the company can use this cash to pay off its debts or use it for other purposes.
The cash ratio is a useful indicator of the value of the firm under a worst-case scenario.
It could also provide insights to investors on the value of current assets that could immediately be turned into cash and the percentage of the current liabilities of the company that this cash and near-cash could cover.
The quick ratio measures the capacity of a company to pay its current liabilities without the need to sell its inventory or acquire additional financing.
It is calculated by using the formula:
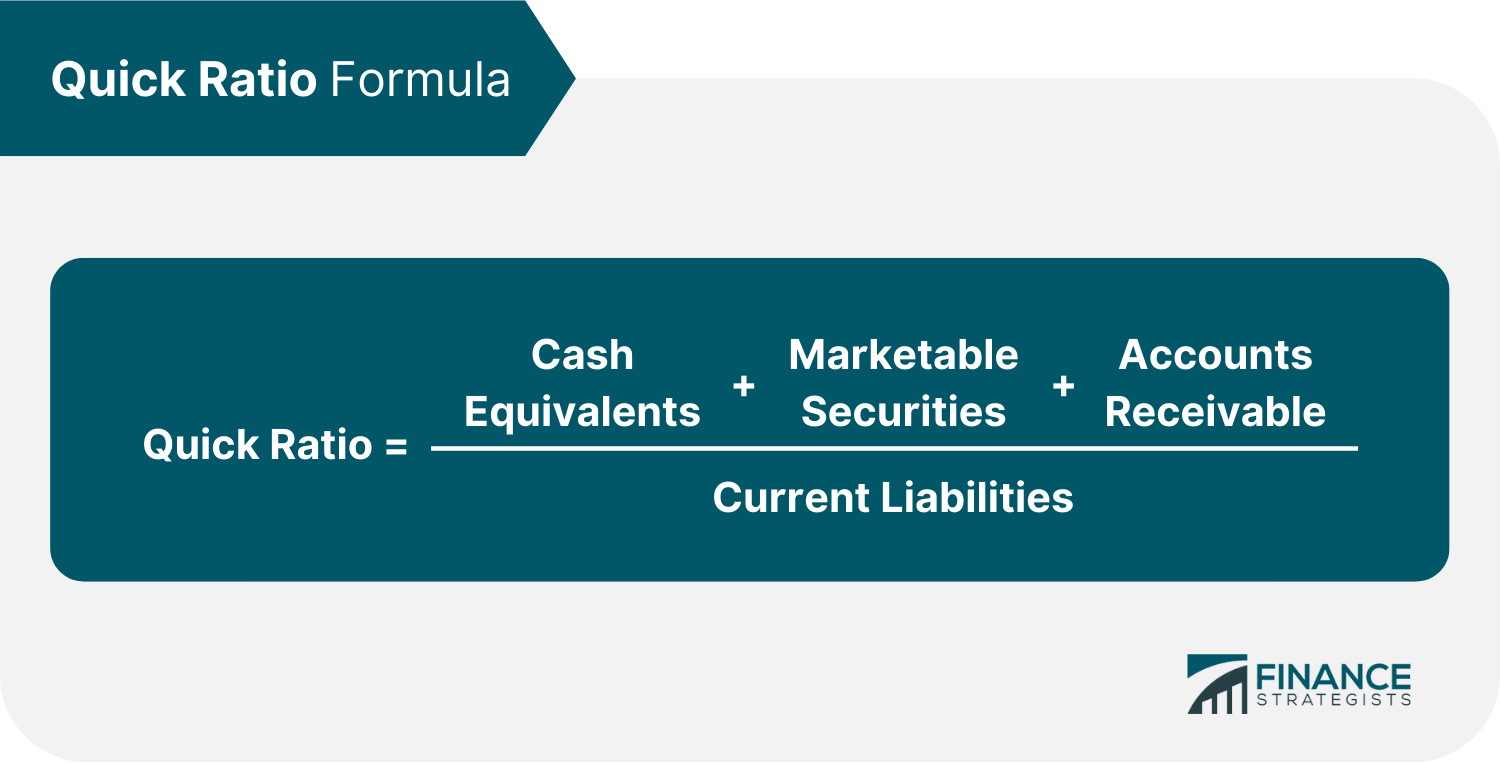
Quick assets are those most liquid current assets that can quickly be converted into cash. These assets include cash and cash equivalents, marketable securities, and net accounts receivable.
The quick ratio is also a more conservative estimate of how liquid a company is and is considered to be a true indicator of short-term cash capabilities.
This is helpful in analyzing a single company over a period of time and can be used when comparing similar companies.
For example, Company A has quick assets of $20,000 and current liabilities of $18,000. Company B has quick assets of $17,000 and current liabilities of $22,000.
Company A and B have quick ratios of 1.11 and 0.77, respectively. This tells us that Company A appears to be in better short-term financial health than Company B since its quick assets can meet its current debt obligations.
The current ratio measures the capacity of a company to pay its short-term obligations in a year or less. Analysts and investors compare the current assets of a company to its current liabilities.
The formula for calculating the current ratio is:
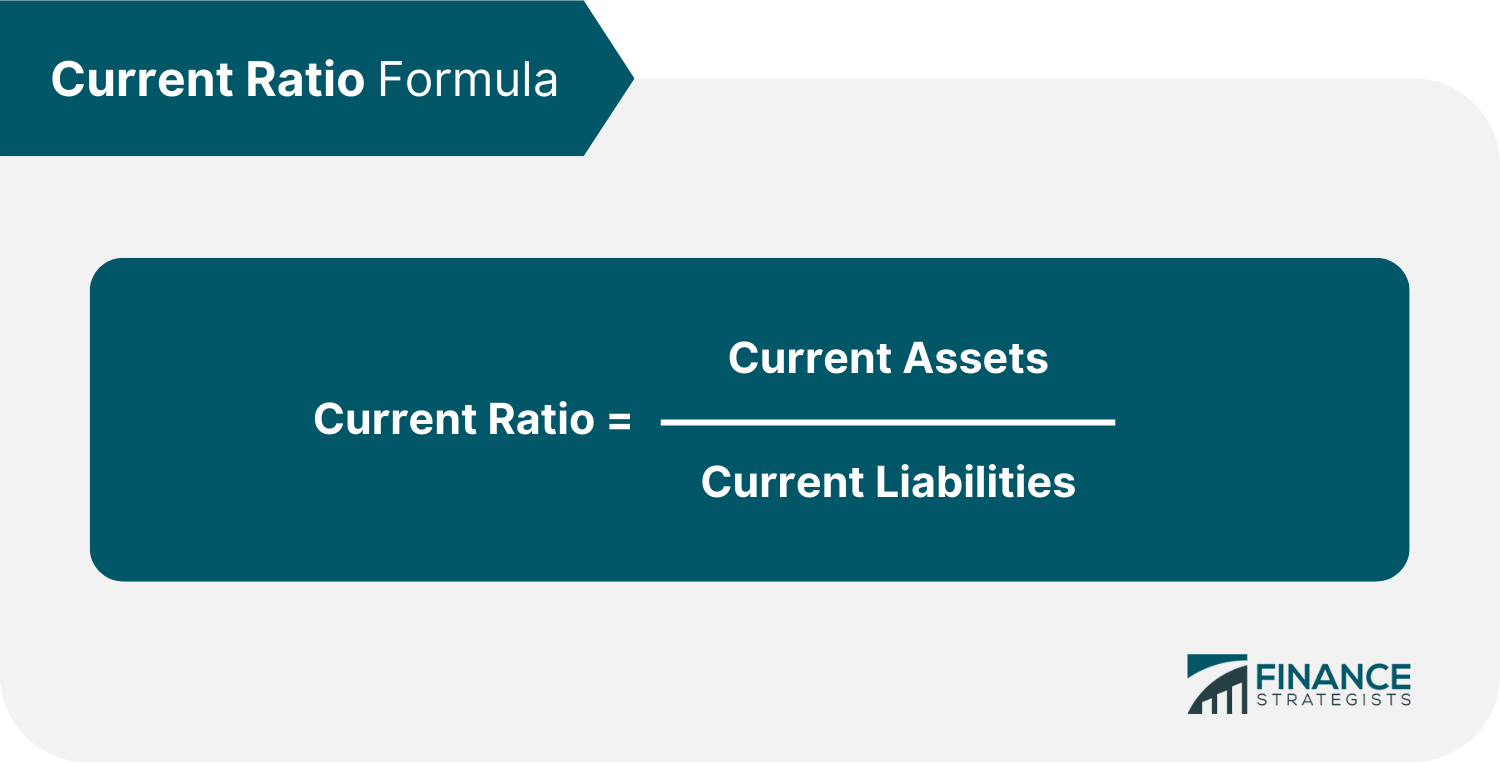
Current assets include cash, inventory, accounts receivable, and other current assets that can be liquidated or converted into cash in less than a year.
Current liabilities include wages, accounts payable, taxes payable, short-term debt obligations, and the current part of long-term debt.
The current ratio reveals how a company can maximize its current assets on the balance sheet to satisfy its current debts and other financial obligations.
For instance, if Company A has $50,000 in cash and $70,000 in short-term debt, which means that the company is not well placed to settle its debts.
The debt-to-equity ratio is one of the most important financial ratios that companies use to assess their financial health. It provides insights into a company's leverage, which is the amount of debt a company has relative to its equity.
The D/E ratio also gives analysts and investors an idea of how much risk a company is taking on by using debt to finance its operations and growth.
It is also important to remember that the D/E ratio is just one financial ratio and should be used in conjunction with other ratios, such as the cash ratio, current ratio, and quick ratio, to get a complete picture of a company's financial health.
A good D/E ratio is generally below 1. However, an ideal D/E ratio varies depending on the nature of the business and its industry because there are some industries that are more capital-intensive than others.
A decrease in the D/E ratio indicates that a company is becoming less leveraged and is using less debt to finance its operations. This usually signifies that a company is in good financial health and is generating enough cash flow to cover its debts.
An increase in the D/E ratio can be a sign that a company is taking on too much debt and may not be able to generate enough cash flow to cover its obligations. However, industries may have an increase in the D/E ratio due to the nature of their business. For example, capital-intensive companies such as utilities and manufacturers tend to have higher D/E ratios than other companies.
A negative D/E ratio indicates that a company has more liabilities than its assets. This usually happens when a company is losing money and is not generating enough cash flow to cover its debts.
Companies can improve their D/E ratio by using cash from their operations to pay their debts or sell non-essential assets to raise cash. They can also issue equity to raise capital and reduce their debt obligations.
About the Author
True Tamplin is a published author, public speaker, CEO of UpDigital, and founder of Finance Strategists.
True is a Certified Educator in Personal Finance (CEPF®), author of The Handy Financial Ratios Guide, a member of the Society for Advancing Business Editing and Writing, contributes to his financial education site, Finance Strategists, and has spoken to various financial communities such as the CFA Institute, as well as university students like his Alma mater, Biola University, where he received a bachelor of science in business and data analytics.
To learn more about True, visit his personal website or view his author profiles on Amazon, Nasdaq and Forbes.

WHY WE RECOMMEND:
Fee-only financial advisors are paid a set fee for their services. They do not receive any type of commission from the sale of products they are advising on.
Retirees, Immigrants & Sudden Wealth / Inheritance
Retirement Planning, Personal finance, Goals-based Planning & Community Impact

WHY WE RECOMMEND:
Fee-only financial advisors are paid a set fee for their services. They do not receive any type of commission from the sale of products they are advising on.
Business Owners, Executives & Medical Professionals
Strategic Planning, Alternative Investments, Stock Options & Wealth Preservation
Finance Strategists has an advertising relationship with some of the companies included on this website. We may earn a commission when you click on a link or make a purchase through the links on our site. All of our content is based on objective analysis, and the opinions are our own.
Content sponsored by 11 Financial LLC. 11 Financial is a registered investment adviser located in Lufkin, Texas. 11 Financial may only transact business in those states in which it is registered, or qualifies for an exemption or exclusion from registration requirements. 11 Financial’s website is limited to the dissemination of general information pertaining to its advisory services, together with access to additional investment-related information, publications, and links.
For information pertaining to the registration status of 11 Financial, please contact the state securities regulators for those states in which 11 Financial maintains a registration filing. A copy of 11 Financial’s current written disclosure statement discussing 11 Financial’s business operations, services, and fees is available at the SEC’s investment adviser public information website – www.adviserinfo.sec.gov or from 11 Financial upon written request.
11 Financial does not make any representations or warranties as to the accuracy, timeliness, suitability, completeness, or relevance of any information prepared by any unaffiliated third party, whether linked to 11 Financial’s website or incorporated herein, and takes no responsibility therefor. The articles and research support materials available on this site are educational and are not intended to be investment or tax advice. All such information is provided solely for convenience purposes only and all users thereof should be guided accordingly.
© 2024 Finance Strategists. All rights reserved.
We use cookies to ensure that we give you the best experience on our website. If you continue to use this site we will assume that you are happy with it.